It’s the holiday season in much of the world, and this year that means not just early sunsets and school breaks but also supply chain woes. Everything, from puzzles and hot sauce to peppermint candy canes, is in short supply this month, as the global economy struggles to get items from point A to point B.
Thinking clearly about this problem can be tricky; there are many specific reasons for the shortages and shipping challenges, and the global supply chain is a large and intricate operation. Fixing the problem naturally requires grappling with all of this complexity. But what if we just want to reason about the high-level contours of the issue, and gain some intuition? That’s where statistical thinking can be helpful.
We can start, as statisticians often do, with a simple model of one part of the supply chain: the container port. Our model will not be realistic, and will ignore almost all of the key features of the supply chain. But it will provide a useful starting point for further analysis—a first approximation to reality that we can later fine-tune as we need.
We’ll pretend that container ships arrive at random times throughout the day, but at a constant overall rate. (In technical terms, we would call the arrival of ships a Poisson process.) And we’ll assume that each ship takes the same amount of time to unload—say, four hours. Most importantly, the ships are unloaded one at a time (the port is only so big, after all); if one ship is being unloaded, every other ship has to wait until it’s fully empty.
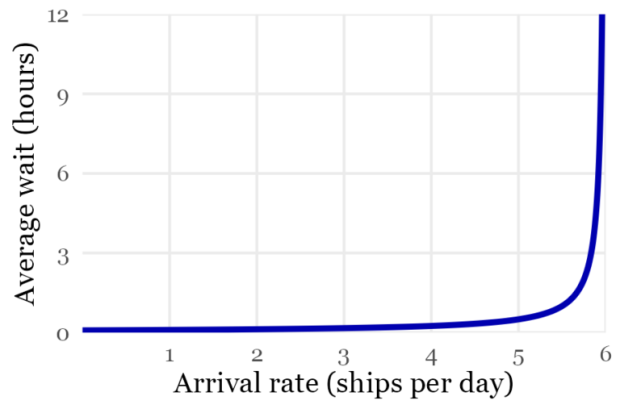
What happens if on average, three ships arrive a day? That translates to one ship every eight hours, on average—though because the ships arrive randomly, there will often be two ships arriving right after one another. Since it takes just four hours to unload a ship, you might guess that this port will run smoothly, and that ships won’t have to wait that long to be unloaded. And you’d be right—the average wait time would be just 10 minutes, and most of the time there would be no line.
But what about if one ship arrived every four hours, on average? Since this is exactly how long it takes to unload a ship, you might think (as I did) that the port would still manage well, with perhaps a short line. In fact, the port would break down entirely. The line would continue to grow and grow without limit. Left alone, the average ship would have to wait an infinite amount of time to be unloaded.

As the graph shows, the port doesn’t respond equally to a decrease or an increase in the arrival rate. As the arrival rate gets closer and closer to the rate at which the ships can be unloaded, the waiting time grows super-exponentially and the port falls apart.
Why does this happen? Even though the ships arrive slow enough to be unloaded in theory, they aren’t evenly spaced out, because of the randomness in when they arrive. As a result, the ships start to bunch up. And once there’s a line, it’s very hard for it to be cleared, because each ship has to wait for the one in front of it to be unloaded completely.
So despite the simplicity of the model for our port, it has provided us with a useful insight: natural variability in when ships arrive, plus the need to unload ships one at a time, means that the system is vulnerable to a catastrophic pileup if even a few more ships start to arrive.
This thought experiment has lessons beyond the supply chain, too. First, it’s a rather striking illustration of the dangers of working with averages alone. Variation matters! Ignoring it can lead to misleading conclusions, a lack of resiliency, or even a candy cane shortage.
Second, it demonstrates the power of models—even simple ones. We ignored nearly all of the real-world complexity of the problem, yet our model could still elucidate the port’s sensitivity to random variability. If we wanted to better understand this phenomenon, or make predictions that were actually applicable to a real port, we’d have to add back in some of this complexity— iteratively strapping on more components to our model, polishing off its rough edges, and making tweaks to address its shortcomings, until it was properly equipped to answer all of our questions. This is exactly what scientists and statisticians do every day to develop models for agriculture, business, politics, the weather—and yes, the pandemic, too. Something we’ll certainly need as we confront yet another wave of the virus.


