On 2 August 2021, the US government announced it had met its goal of 70% vaccinated. But what does that mean? 70% of what? And what does vaccinated mean? Well, they meant that 70% of US adults has received at least one dose of vaccine. That actually means 59% of the population in the United States has received at least one shot (and thereby are fairly well protected against the COVID-19 disease with the possible exception of the delta variant). It corresponds to 69% of those 12 and over (who are eligible for the vaccine in the US). But in terms of the entire population, those fully vaccinated (with one or two doses, depending on the vaccine used) make up 50%. The risk of catching the disease for vaccinated people is relatively low, but much higher for unvaccinated individuals.
Let me do a back-of-the-envelope calculation. I’ll assume that the reproductive rate (the average number of susceptible individuals infected by an infected person) of the delta variant of the disease is about 8, the same as chicken pox, and infected individuals spread only to randomly chosen unvaccinated individuals (vaccinated people can also get the disease, but it is not as common, and spread is to individuals you are in contact with, not randomly chosen people). Under this scenario, one would need about 88% vaccinated to stop the spread – each infected individual tries to infect 8 people and if 12% are unvaccinated they would manage to infect just under 1 individual (8 x 0.12 = 0.96) —not enough to maintain the spread of the disease. Masks and social distancing reduce the reproductive rate, requiring a smaller proportion of people be vaccinated to stop the spread. If the reproductive rate gets cut in half (to 4) by these measures, we would only need 75% of the population vaccinated to stop the spread.
The worldwide vaccination rate as of 6 August 2021, was 29.7% for at least one dose, and 15.3% for fully vaccinated. For most of the world, there is a very long way to go. Only Canada and Spain had over 70% of the population vaccinated with at least one shot on that day. Here is a map of the worldwide rates.
In the U.S. state of Washington, where I live, the vaccination rate is 70% of the vaccine eligible with at least one dose -this corresponds to 59% of all residents in the state, with 53% fully vaccinated. By county (within the state), the percent of residents who are fully vaccinated varies from 26% to 71%.
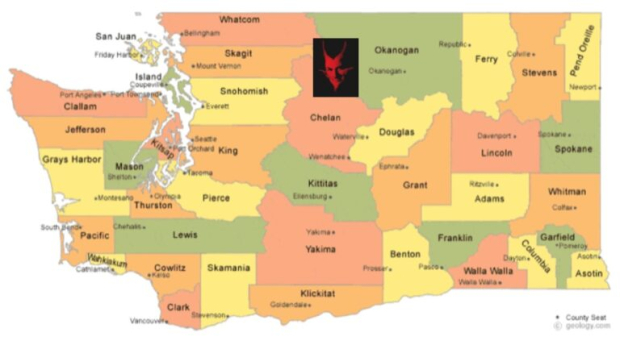
To understand this vast range of vaccination rates, we must consider the geography of the state. The Cascade mountain range separates eastern and western Washington, with the eastern part comprising two thirds of the state’s area and 20% of the population. The east is mainly rural and agricultural, while the west is more urban and industrial. Politically, the west is more liberal/left wing while the east is more conservative/right wing. Climatically, the west is wet and mild, while the east is dry, cold in the winter, and hot in the summer.
Here is a plot of the vaccination rate by county population size, with eastern Washington counties in red.
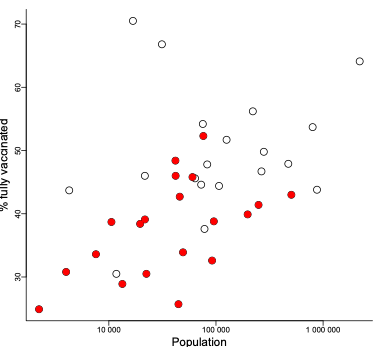
We see that counties with high vaccination rates tend to be in the western part of the state, and counties with low vaccination rates are mostly in the east, and have smaller populations.
The political divide between east and west, and its likely influence on vaccination rate, is apparent when also taking into account the percent republican vote in the 2020 US presidential election (see below figure, where size of the symbol indicates relative population size). We see that almost all eastern Washington counties have high Republican vote and low vaccination rates.

Most counties in Washington are at very high or extremely high risk for COVID-19. There does not seem to be any relation between the risk situation for unvaccinated people and the location of the county except, of course, that counties with lower vaccination rates have a greater proportion of residents at the higher risk.
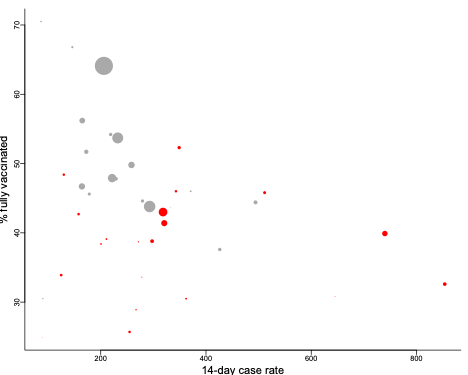
A final figure (below) shows the relation between case rate over the latest fortnight (at the time of writing this post) and vaccination rate. Overall, the information in the plot reveals several of the counties in eastern Washington are susceptible to spread of the delta variant of the disease. You just need a single unvaccinated infected person in a county that does not practice social distancing to get a large outbreak. Such outbreaks seem to be on the way again in Washington right now.
This type of analysis can be done anywhere. And it can go down to smaller scales than counties, as well as look at other explanatory variables. The point is that saying “70% of the US adults are vaccinated” is not very informative.