
When state governments within the United States issued stay-at-home orders in 2020, companies started providing interactive data visualizations and dashboards to show how well or not so well certain regions of the United States were social distancing. Unacast, a technology company out of New York state, was one of them. They gathered smartphone data from up to 15 percent of people in every county of the United States, and then assigned grades to each state based on how much smartphone users traveled after COVID-19 related closures, compared to before.
In March 2020, news articles, such as this one in Forbes and this one in U.S. News, praised Washington D.C., Nevada, and other states for reducing their average travel distance by over 50 percent. These regions received an A+ whereas more rural states, such as Wyoming, received an F for only having a 6 percent difference in average travel behavior.
At the time, some people made comments that those living in the rural states with low grades were not taking stay-at-home orders seriously and did not care about their communities. As someone who grew up in a rural state and has family in Wyoming, I would argue otherwise – I could see that privacy restrictions on the data led to improper analyses and conclusions. Given my statement, you might be thinking that “the analysis is the analysis” – that the data the Unacast analysts collected obviously shows that people in rural states are moving about the same amount on average as they did before. However, analysts often forget that data analyses are imperfect due to how data are collected and limitations in data collection can create incomplete data stories that are misleading.
But, what do I mean by having an incomplete or misleading data story and how could the problem be caused by data privacy? I will use myself as an example to help explain.
Early in 2020, I lived in Washington, D.C. to start my new position on researching data privacy problems for a public policy institution. My daily routine consisted of biking five miles from Arlington to downtown Washington, D.C. and back, or taking the metro around the area. At the time, I would stop by the grocery store or a restaurant for takeout after work each day, where both options were within a half mile radius of my apartment. When COVID-19 hit and my work closed their downtown office, I stopped commuting to Washington D.C. and went to the grocery store once every few days to reduce my interactions with people. In this situation, I reduced my average weekly distance of roughly seventy miles down to about one mile – more than a 95 percent change in my travel behavior.
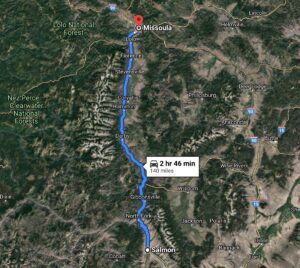
When I lived in Salmon, Idaho, my family and I lived five miles outside of the city limits in the country. We also did not grocery shop each day or even every other day. My family went to the local grocery store once a week for fresh produce and made our monthly 140 mile shopping trip to Missoula, Montana to stock up on all the items we needed for the month at Costco, a wholesale retail store, and other major stores. In one week, my family and I could easily travel upwards of over 350 miles from shopping to attending school or going to work.
Despite a global pandemic, people who live in these rural parts of the country will not change their habit of going to the grocery store once a week or once a month. They are already living at the minimum frequency to shop for food and other household essentials. And as for my family, these trips likely consume the bulk of a rural family’s average traveling distance. This means that even if my family and I were to work remotely or attend school virtually, our overall average distance traveled would still be roughly the same pre- and post-coronavirus. Specifically, if I had removed my commutes to school, then my travel behavior would have changed from 350 to 300, about a 17 percent difference.

Overall, the social distancing dashboard example highlights more problems of not having better access to higher quality data due to privacy concerns for small populations. If Unacast had access to data that tracked people’s movement to the census tract or individual level, then the company might have seen the residents of Wyoming practicing social distancing well relative to their essential movements, such as shopping at the grocery store. But, in the field of data privacy and confidentiality, higher quality information comes at a price of less privacy protection for those who are represented in the data. Unacast might have lacked more detailed data about the destinations of movements because of how most data privacy and confidentiality methods tend to aggregate or remove information to protect people in smaller sub-populations.
Overall, we must carefully take into account how data are collected and disseminated, or we risk missing a vital piece of the data story, especially when data sets are aggregated. Not taking this care can cause unintended harm to those we are trying to protect through data privacy and confidentiality policies.