There is a lot of talk about how this ghastly pandemic is affecting the economy. The other day, I came across an article in the The New York Times which focused on one facet of this topic: inflation in the UK. Forecasting inflation right now is difficult because of the pandemic: sudden changes in consumer spending, disruptions in supply chains, and government interventions ameliorate its effects.
Inflation is measured by observing changes in price indices. To create such an index, you need a basket of goods and services, prices, and some mechanism of combining those prices into a single value. If that value increases across two time periods, it means prices (generally) are rising, indicating inflation; if the reverse occurs, then we call it deflation.
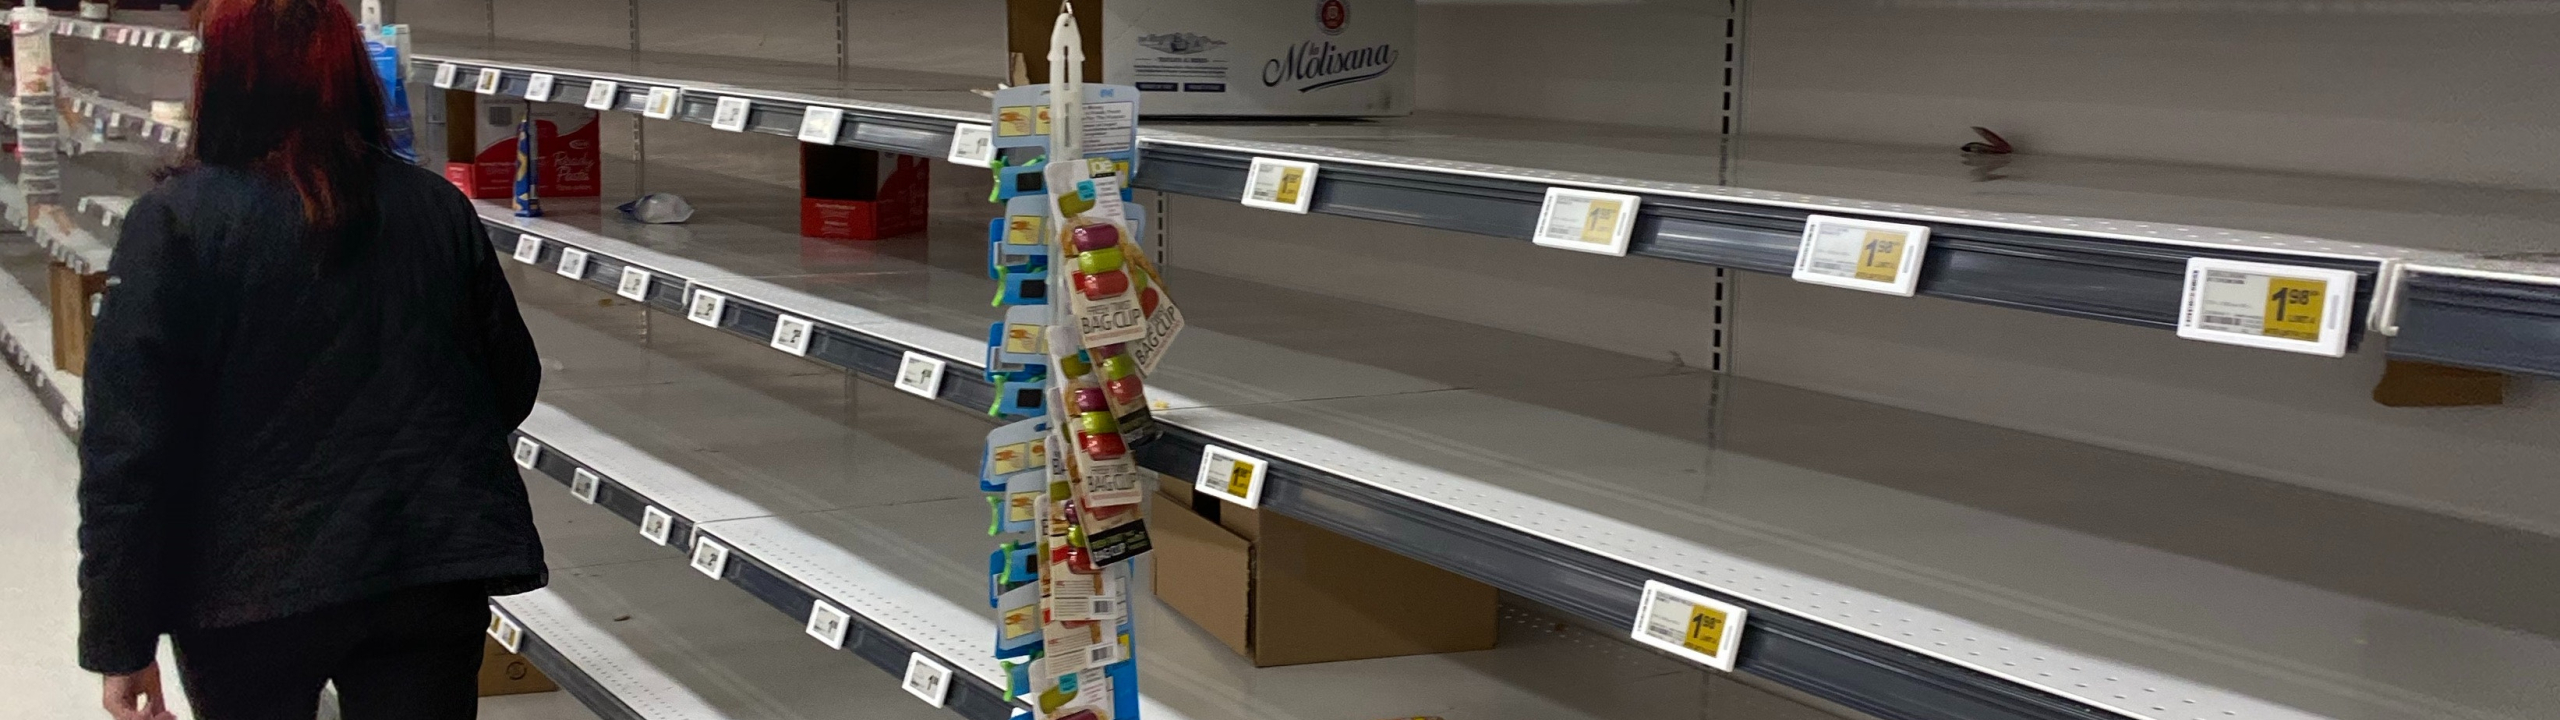
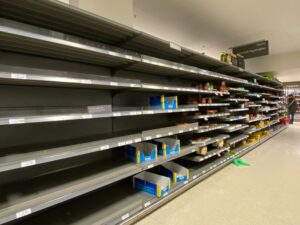
The article focused on the various products whose prices are tracked to calculate the UK’s Consumer Prices Index (CPI). It noted that some spending shifts spurred by the pandemic, may, in fact, become permanent. As a result, “hand weights, men’s loungewear pants, along with hand sanitizer” were being added to the price index. On the other hand, the “staff restaurant sandwich” was dropped as people who did have in-person work schedules were evidently avoiding the office cafeteria. Interestingly, face masks were not added in the hopes they would be a temporary blip in consumer spending.
These types of decisions involve a level of subjectivity and the question is whether that is problematic.
In the UK, the Office of National Statistics (ONS) is the government agency which produces the CPI (and the broader CPIH, which incorporates some housing-related costs). They decide what goes into the “basket of goods.”

Considering the contents of a basket is something I find particularly fascinating. Fundamentally, the contents reflect consumer spending, but that just hides the fact that the chosen products are culturally specific. For example, after wading around the ONS website, I was thrilled to learn that 2021 also marked the year peanut butter was added to the UK’s basket of goods. (It’s been on the US list for quite some time, where I live.) That must mean enough people are purchasing—and presumably eating—peanut butter to warrant a coveted spot in the basket. (Another example is that couscous was also added this year.)
Determining which products go into the basket is a gnarly task because it requires thinking hard about what it means to be a “representative good.” Hypothetically, we could think of an exhaustive list of every good or service available to UK residents. From that list, we could select a random sample of items which would be added to the basket – maybe after splitting it into types of goods (or strata). This is a standard way of attempting to draw what is considered a representative sample in statistics and exploits the nature of randomness. That said, we immediately hit a snag.
The key word above is not “random” but “hypothetically”. It’s impossible to actually make such a list. (It’s also impossible to keep such a list continually up-to-date.) To illustrate: I went to the Sainsbury’s website, a popular grocery store in the UK, and typed in “peanut butter.” Here is what appeared: Whole Earth Crunchy Peanut Butter 454g, ManiLife Original Roast Smooth Peanut Butter 295g, Sainsbury’s Smooth Peanut Butter 340g, and so on. There are around 30 brands and size combinations. And this is just at one supermarket.
This means, in practice, a representative basket of goods is hand-picked to be emblematic of a country’s purchases. This is not to say that these decisions are made without evidence, rather that they do not hew to the statistical notion of representative.
In the UK, the ONS selects items primarily based on data from household final consumption expenditures (HHFCE) and the Living Costs and Food Survey (LCF). Information, such as the availability of products across the country, external reports such as trade journals, or anecdotal evidence from the people who visit stores to check prices, is also taken into consideration. ONS then uses its judgment to assemble the basket, combining insights gleaned from both quantitative and qualitative sources.
Measures, like price indices, are most useful when their definitions are consistent over long periods of time. That way we can be more confident that an observed fluctuation is because of a real change, and not because things were calculated differently. There are two reasons why this can break down. First, new techniques are developed, so an old procedure becomes antiquated. Second, and more relevant to us here, is that underlying conditions shift—i.e. consumers change their spending habits—and so the measure must be updated to reflect a new reality.
This year, the ONS seems to have made some changes based on longer-term trends – more malt chocolate, less white chocolate purchased – and others based on expected trends – like hand sanitizer usage. (It’s useful to note here that the basket of goods does not represent purchases for any individual, but rather aggregate spending. I’ve made it abundantly clear that I love peanut butter, but you may not. On the other hand, I live in an apartment so I have no use for a lawn mower.)
While the CPI is used by the UK government, that in and of itself is not sufficient to make it good. The question that remains is why we pay attention to the CPI when the way the basket of goods is chosen deviates so sharply from standard statistical methodology. However, this is a question which is less about statistics, and more about trust and transparency. At the very least, we can make sense of the decisions the ONS makes, even if we don’t agree with them, because it publishes annual bulletins explaining what is added, removed, and why. Moreover, anyone can examine the data and read about the methodology. The reputation of the ONS and its attempt to be transparent allows us to evaluate both the quantitative and qualitative aspects of its decision-making. Both are essential to constructing a price index. More importantly, however, transparency is what allows us to have this discussion in the first place.